Processes
Open Processes in the sidebar to see every app worker and task invocation running on your items, with the memory and CPU each one uses. The page is available to users with the Developer or Admin role.
It lists processes of items you own or collaborate on with the Contributor role or higher. Select an item’s name to open its runtime tab.
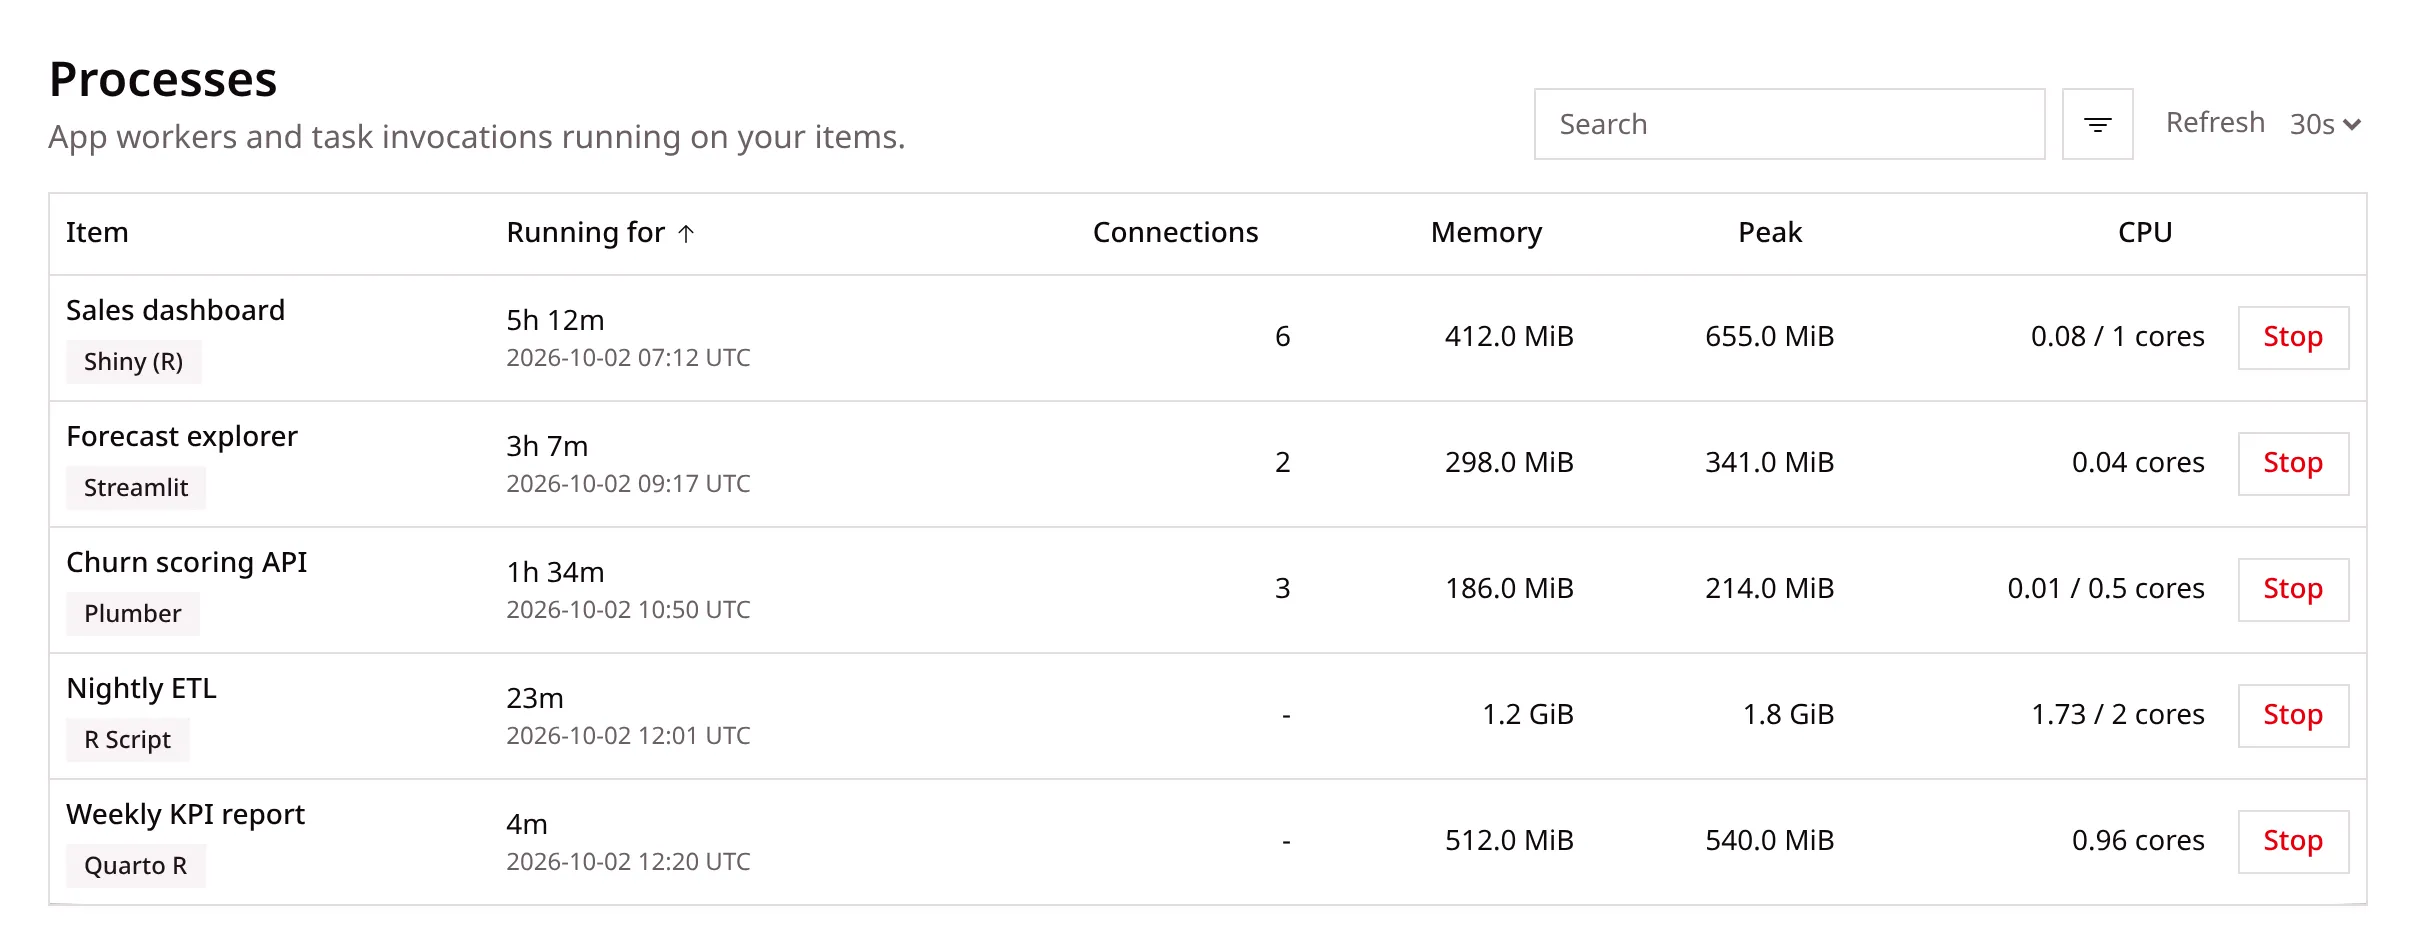
What each row shows
Section titled “What each row shows”| Column | Meaning |
|---|---|
| Running for | How long the process has run, with its start time in UTC |
| Connections | Open connections to an app worker, shown as - for task invocations |
| Memory | Memory the process uses now |
| Peak | The most memory the process has used since it started |
| CPU | CPU cores in use, beside the item’s CPU limit when one applies |
The CPU limit is the one set in the item’s runtime settings. It shows only on servers that run content in Docker or Kubernetes, since other servers do not limit CPU.
Find a process
Section titled “Find a process”- Type in Search to match item names.
- Open the filter menu to show only app workers, only task invocations, or chosen content types.
- Select a column header to sort by it, and select it again to reverse the order.
The list refreshes every 30 seconds. Pick another interval from Refresh, from 5 seconds to 5 minutes. The page returns to 30 seconds the next time you open it.
Stop a process
Section titled “Stop a process”Select Stop on a row and confirm.
- Stopping an app worker ends the session of anyone connected to it. The app starts a new worker when it next needs one.
- Stopping a task invocation ends that invocation only. The task’s schedule stays in place.
Admins
Section titled “Admins”Admins can switch between My items and All items to see every process on the server, and can stop any of them.